Fruitbull optimizes the quality of its data.
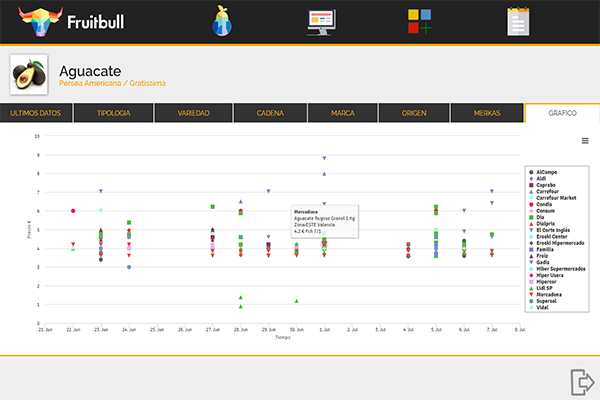
The platform of this Spanish startup is offering a new analytic tool able to compare the information of all supermarkets collected in the same scatter plot.
Madrid, July 6, The company pioneer of generation of data in real time for the fruits & vegetable market. On July 1, Fruitbull presented new developments in its application in order to be more functional as well as increase the reliability of its data.
On may, months after its launch in Spain, Fruitbull started a qualification data process. After this, and thanks to the management of different variables that affect each of the products analyzed, they have been able to create new graphics market analysis.
This report is made by a system of scatter plot of the product. This graphics are based on a dot matrix on two axes (in this case, prices vs time), where every one of them has incorporated nine variables from the product itself to the point of sale and final price.
This graphic was build throughout Highcarts, a JavaScript charts also used by renowned companies like Facebook, Yahoo, LinkedIn, Twitter, among others.
The main features of the graphic are:
- Dynamic zoom of each sector that the clients wants
- Exports of graphics in different formats: JPEG, PNG, PDF, SVG
- Filters to have visibility of the chains
- Adapted to the resolution of the device used by the client
In the upcoming months, similar developments are planned in terms of improving the visibility of data and functional analysis, we will inform you.
Volver

 Home
Home About us
 Products
 News
News Tutorials
 Contact us